Category: UX/UI Design

After all the evidence is gathered, this is where I “Draw the Final Suspect Sketch.” This section features the tangible artifacts of my work: high-fidelity visual design, interactive prototypes, information architecture, and interaction design. It proves my proficiency in crafting intuitive, accessible, and aesthetically engaging interfaces that bring the strategic vision to life.

  • Kount Compliance: A Legacy System Modernization

    Kount Compliance: A Legacy System Modernization

    Project Outcomes at a Glance

    Success Rate +50%

    Task success skyrocketed from a frustrating 45% on the legacy tool to a confident 95% on the new MVP.

    -60% Time on Task

    We slashed the average time to complete a core compliance task from 120 seconds down to just 48 seconds.

    SaaS Enabled

    The redesign transformed an internal utility into a commercial product, enabling sales to major financial partners.

    Project Details
    My Roles
    • Senior UX/UI Designer
    • UX Researcher
    • Service Designer
    • Interaction Designer
    • Design System Governance
    Timeline
    • Two Years

    Tools & Methods
    • Figma & Figjam
    • Optimal Workshop
    • Qualtrics
    • Jira
    Project Details

    The Challenge: A System at Breaking Point

    Equifax’s analysts were fighting a daily battle with their tools. The 20-year-old legacy platform was a dense wall of data that forced users to open multiple browser tabs just to research a single case. It was slow, prone to crashing, and visually overwhelming. This inefficiency wasn’t just annoying—it created regulatory risks and made it impossible for the business to sell the tool to external clients like JP Morgan or Wells Fargo.

    Understanding the Users

    We couldn’t just “skin” the old app; we needed to understand the people using it. Through interviews and workshops, we identified three distinct personas with conflicting needs:

    • Eleanor (“The Regulator”): Needs absolute precision and audit trails. She feared the old system’s data discrepancies.
    • Ben (“The Data Detective”): Wants speed and keyboard shortcuts. He hated the slow load times and mouse-heavy workflows.
    • Maria (“The Business Partner”): Needs clear communication tools to explain compliance decisions to business units.

    The “Aha!” Moment

    During our workflow analysis, we realized that the core task of compliance—triaging alerts, investigating details, and making a decision—mirrored a pattern everyone already knew: Email.

    We shifted our design strategy to use a familiar “Inbox” mental model. This meant a persistent list on the left and a detailed workspace on the right, eliminating the need for those frustrating browser tabs.
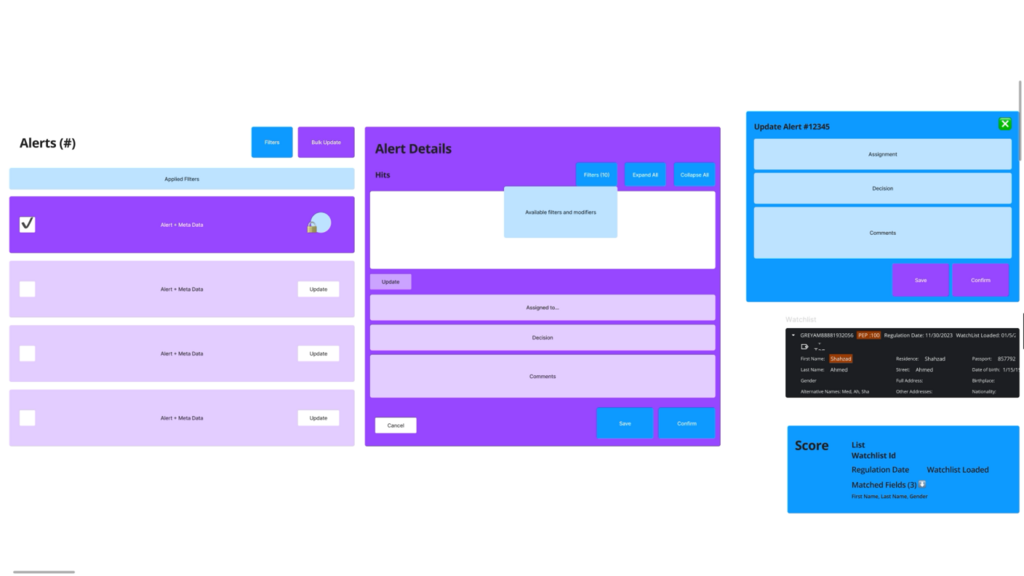
    Initial Block Diagram
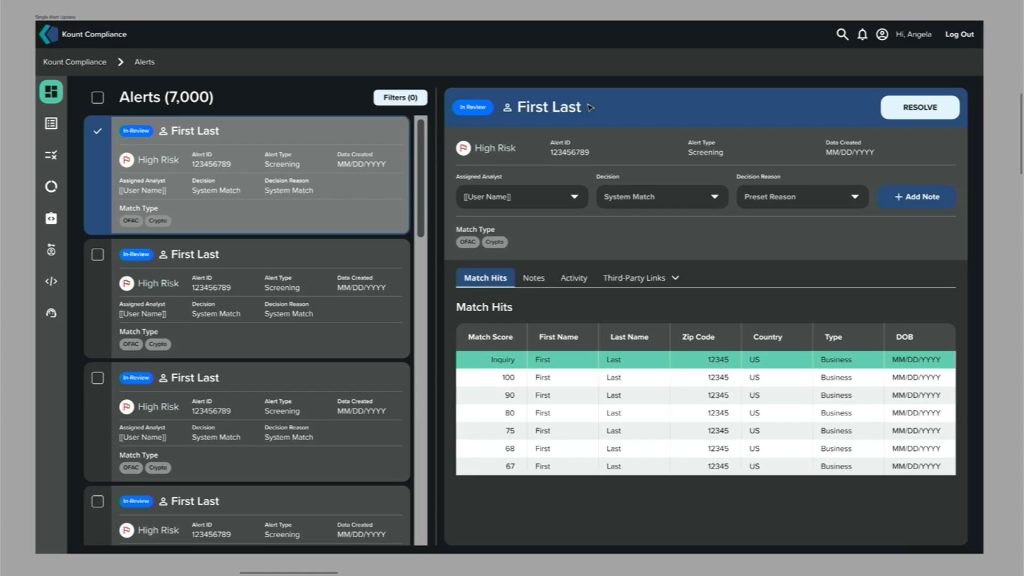
    First High-Fi Iteration

    The Solution: Kount Compliance MVP

    • The final design delivered a clean, two-column interface that balanced density with clarity.

      • Unified Workspace: We killed the “tab tax.” Analysts can now view the queue and the case details on a single screen.
      • Tabbed Data: Complex information (Sanctions, Adverse Media, PEPs) was organized into tabs, reducing cognitive load.
      • Bulk Actions: We added the ability to select multiple alerts and disposition them instantly—a huge win for our power users like Ben.

    Validation & Impact

    We didn’t just guess; we tested. In a head-to-head A/B test with 15 participants, the results were undeniable.

    Key Takeaways

    The success of Kount Compliance reinforced that the most effective designs often leverage patterns users already know. By shifting to a familiar “Inbox” model, we didn’t just speed up workflows; we virtually eliminated the learning curve.
  • Book Nook: Building a Digital Community for a Physical Bookstore

    Book Nook: Building a Digital Community for a Physical Bookstore

    Project Outcomes at a Glance

    +35% Engagement

    Shared notes and book clubs drove community engagement, causing a massive spike in daily interaction.

    4.8 Star Rating

    App store reviews highlighted the intuitive design and unique social features, driving a high rating.

    +20% Active Users

    The new social ecosystem built a ‘sticky’ experience that encouraged active users to return daily.

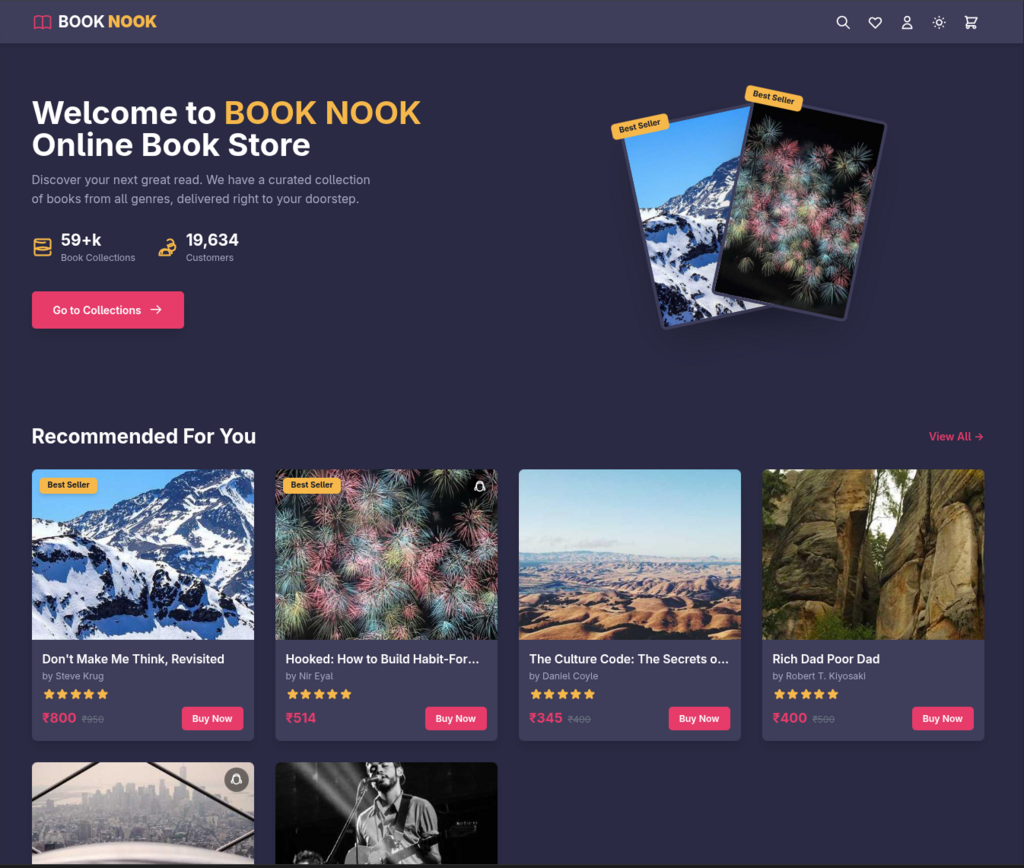
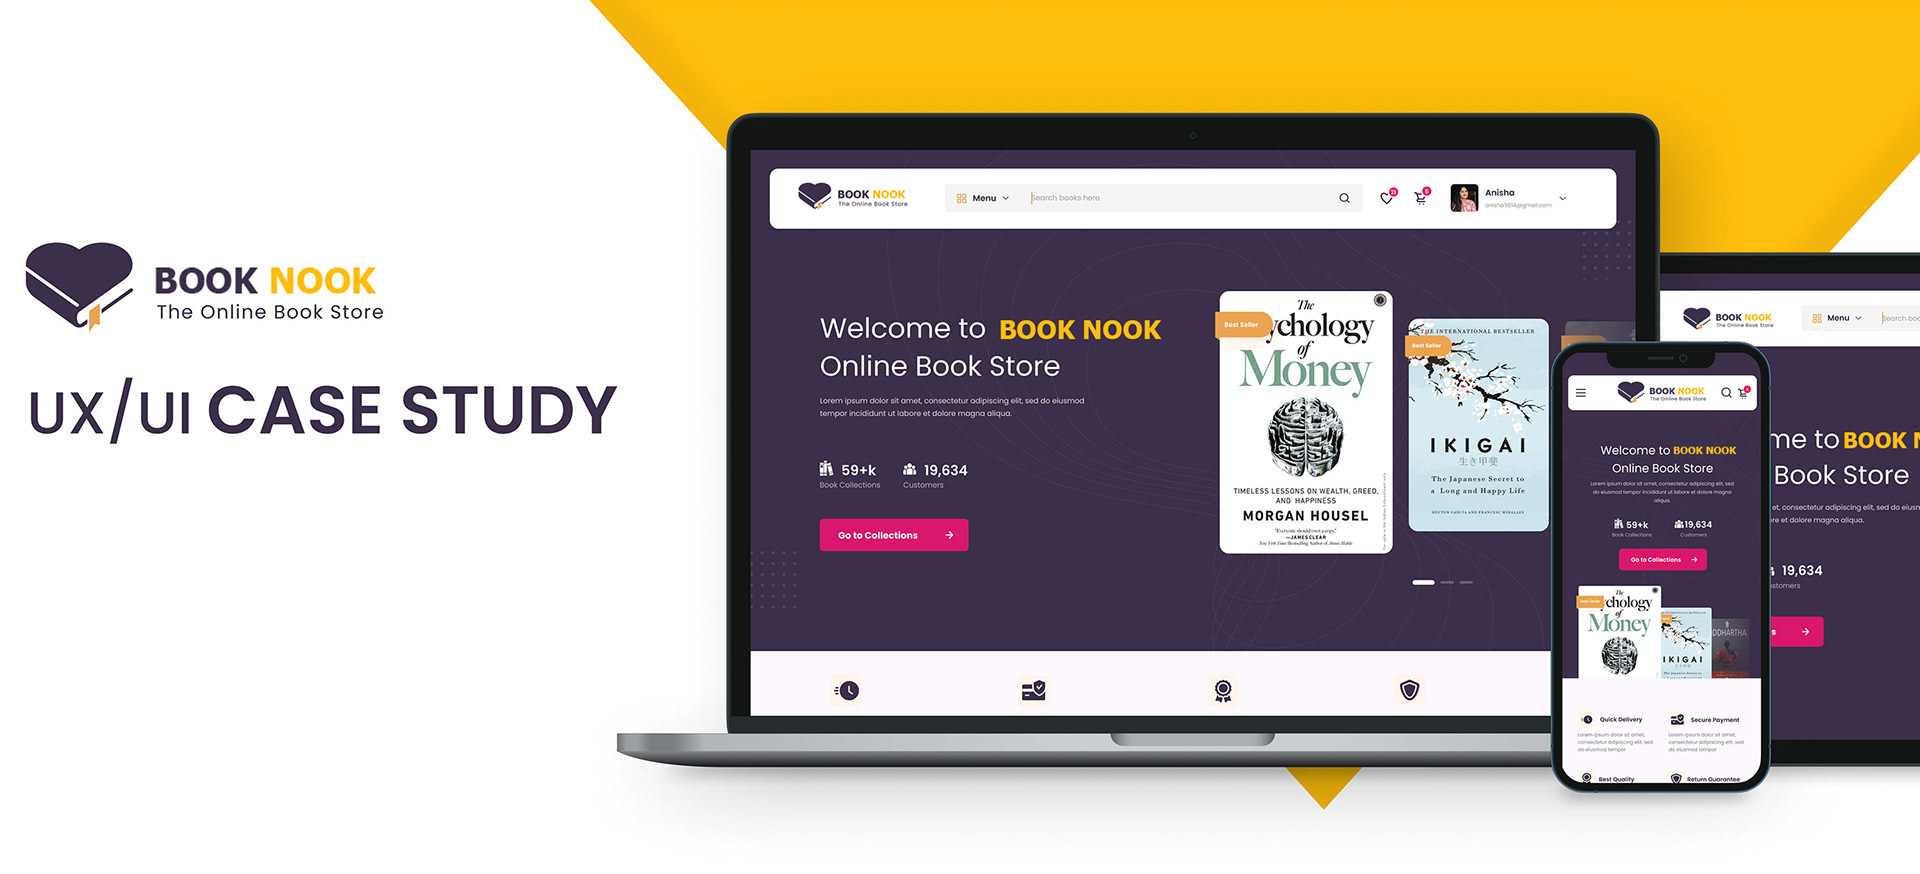
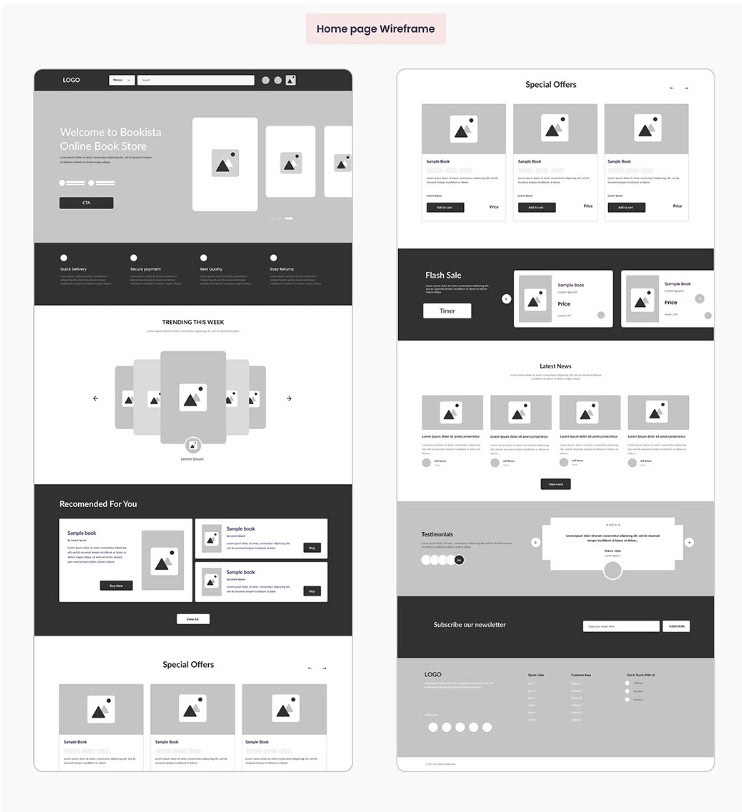
    Early conceptualization: Low-fidelity wireframe of the app’s core features.
    Refined vision: High-quality prototype demonstrating the app’s final look and feel.

    Project Details

    My Roles
    • UX/UI Designer
    • Lead Researcher
    • Team Lead
    Timeline
    • Six Months
    Tools & Methods
    • Figma (Prototyping)
    • Miro (User Flows)
    • Maze (Testing)
    • Affinity Mapping
    • User Interviews
    • Surveys
    Project Assets

    The Challenge: The “Lonely Reader” Problem

    Our research revealed a paradox: while reading is a solitary activity, the *joy* of reading often comes from sharing it. Customers loved the physical bookstore for its recommendations and conversations, but once they left, they felt disconnected. Existing e-reader platforms were sterile and lacked robust community features, leaving a gap between the digital convenience users wanted and the human connection they craved.

    My Approach: Research-Led Empathy

    We couldn’t just guess what users wanted. I led a robust research phase involving 50 participants to dig deep into behaviors. We used a mixed-method approach—combining 20 in-depth interviews with a broader quantitative survey—to validate our assumptions. This helped us move past the generic “social network for books” idea and focus on what really matters: intimacy and trusted curation.

    From Insight to Action

    The data from our 50 participants uncovered four key insights that directly shaped the MVP:

    • Intimacy Over Noise: Users didn’t want another massive public forum like Goodreads. They wanted small, private spaces—”digital living rooms”—to talk with people they actually knew.
    • The “Book Hangover”: 72% of users struggled to find their next book. They trusted friends over algorithms, so we pivoted the discovery feed to highlight friend activity first.
    • Shared Context: Users wanted to share specific passages, not just general thoughts. We designed a “Shareable Annotation” feature to let users highlight text and push it directly to a book club discussion.
    • Logistical Friction: Coordination was a major pain point for book clubs. We decided to build scheduling tools directly into the app to solve this administrative headache.

    The Solution: A Companion App

    The final design for Book Nook isn’t just an e-reader; it’s a hub for the store’s community.

    • Private Book Clubs: Users can easily create invite-only clubs, complete with chat channels, meeting schedulers, and progress tracking.
    • The “Shop Local” Connection: A direct link to the brick-and-mortar store allows users to check inventory and order physical copies for pickup, driving foot traffic back to the shop.
    • Social Reading: The reading interface allows for “social highlighting”—seeing where friends have left notes (if shared) creates a feeling of reading together, even when apart.

    Final Comparison Before our Proposal and After

    Key Takeaways

    This project proved that digital experiences don’t have to compete with physical retail—they can enhance it.

    Ultimately the store did not choose to move forward with our pitch but it was a great exercise in market research and information architecture.

  • Avocademy Mentor Portal: Scaling Student Success

    Avocademy Mentor Portal: Scaling Student Success

    Project Outcomes at a Glance

    Less Busywork

    Centralized data and simplified tasks are projected to cut administrative time by 20%, giving mentors their day back.


    One-Stop Shop

    We killed the “tab tax.” Mentors now have a single dashboard, eliminating the need to juggle Keap, email, and spreadsheets.

     
    Ready to Scale

    The new adaptive system handles volume effortlessly, supporting growth from 300 to 1,000+ students without breaking a sweat.

    Project Details
    Core Responsibilities
    • Senior UX/UI Designer (Team of 6)
    • UX Research Lead
    Timeline
    • Two Months

    Tools & Methods
    • Miro (Affinity Mapping, Workshops)
    • Figma (Prototyping)
    • Usability Testing
    • User-Centered Design (UCD)
    The Challenge: Growing Pains

    Avocademy started strong, but success brought its own set of problems. The team initially managed students on spreadsheets before moving to Keap, a standard small-business CRM. While Keap checked the boxes for basic management, it wasn’t built for the human nuances of mentorship. Mentors were getting bogged down—struggling to track milestones, consolidate feedback, or spot struggling students in time. They needed a tool that worked for them, not against them.

    My Approach: Championing the Mentor

    My role was to lead the design team in solving this operational puzzle with a heavy dose of empathy. We needed to look past the technical constraints of the CRM and focus on the people behind the screen. I led the research and strategy, ensuring we didn’t just build a prettier interface, but a simpler, more intuitive workflow that respected the mentors’ time.

    From Insight to Action

    We moved fast, keeping our process iterative and grounded in feedback:

    • We Listened First: Before designing a single pixel, we interviewed 35 mentors. Using Affinity Mapping in Miro, we uncovered the real headache: it wasn’t just “software issues,” it was the mental load of chasing down information across three different apps.
    • Collaborative Design: We ran a workshop to sketch out solutions, rapidly focusing on a centralized dashboard that acts as a “home base.”
    • Testing Real Scenarios: We built an interactive Figma prototype and put it in front of mentors. We watched them try to leave feedback and check schedules, refining the flow until it felt natural.
    • Smart Integration: We didn’t reinvent the wheel; we just made it roll smoother. The design is adaptive to Keap, pulling in the necessary data while presenting a custom, friendly face to the user.
    Avocademy Research Affinity Map

    Research Synthesis: Mentor Pain Points

    Source: 35 Mentor Interviews & Observations

    Quotes Observations Pain Points

    Theme 1 Information Chaos

    “I have to open 3 different tabs just to find a student’s email address.”

    “Keap doesn’t show me their last project submission. I have to dig through Drive.”

    I keep my own spreadsheet because the CRM is too slow.

    Mentors constantly alt-tabbing between Calendar, Email, and Keap during calls.

    Key Insight

    Information is siloed. Mentors act as “detectives” piecing together data.

    Theme 2 The Scheduling “Ping Pong”

    “Emailing back and forth for 3 days just to pick a 30-min slot.”

    “Students forget to show up because there’s no auto-invite sent.”

    Time zone confusion makes me miss meetings.

    Observed mentor manually typing zoom links into 5 different emails.

    Key Insight

    Administrative friction (scheduling) eats up valuable mentoring time.

    Theme 3 Lack of Visibility

    “I don’t know who is falling behind until they actually quit.”

    I need a “Red Flag” list.

    “Who hasn’t submitted anything in 2 weeks? I have no way to check easily.”

    “Manually checking 20 folders every Friday takes me 2 hours.”

    Key Insight

    Mentorship is reactive, not proactive, due to lack of aggregate data.

    Theme 4 Mentor Experience

    “I spend more time on admin than actually helping students.”

    “The current tools feel cold. I want to feel connected.”

    Mentors expressed anxiety about “dropping the ball” on a student.

    Idea: “What if I could see their face on the dashboard?”

    Key Insight

    Current friction reduces job satisfaction and mentor-student connection.

    The Solution: Mentorship, Simplified

    The Avocademy Mentor Portal isn’t just a tool; it’s a relief. It brings everything a mentor needs into one clean view.

    • No More Detective Work: The Student Dashboard gives an immediate snapshot of every student’s status. Mentors know exactly who needs help the moment they log in.
    • Proactive, Not Reactive: Visual Milestone Timelines make progress tracking automatic. Mentors can now spot “at-risk” students early, reaching out before problems escalate.
    • Click Less, Do More: We streamlined the core actions—scheduling calls and leaving feedback—so they happen in seconds, not minutes.
    • Ultimately, this system allows Avocademy to scale confidently, knowing their technology can handle the growth without sacrificing the personal touch that defines their brand.

    Key Takeaways

    This project reminded me that sometimes the best UX work is invisible—it’s about removing barriers so people can do what they do best.

  • Building Connect Plus: Modernizing Commercial Building Management for Mitsubishi Electric

    Building Connect Plus: Modernizing Commercial Building Management for Mitsubishi Electric

    Project Outcomes at a Glance

    100% Java Elimination

    Completely removed all browser compatibility risks and security vulnerabilities associated with the legacy Java applet dependency.

    40% Efficiency Gain

    Estimated reduction in building control and remote diagnostic time due to the clean, data-first dashboard designed for NOC environments.

    Unified Platform

     Design system and technical documentation, providing a single source of truth for all future HVAC and third-party integrations.

    My Project Roles
    Core Responsibilities
    • Senior UX Designer & Prototyping Lead
    • UX Researcher (Three-Month Field Study)
    • UI Developer (HTML5 Component Build)
    • Platform Architect & Technical Strategy
    Tools & Methods
    • Research: Training Facility Interviews, User Flows
    • Design: Adobe XD, Miro
    • Handoff: Zeplin, Design System Documentation
    • Tech Stack: HTML5, Modern JavaScript, CSS
    The Challenge: From Research to HTML5 Implementation

    My action started with an intensive three-month research phase at our training facility, engaging directly with our primary users: field installers, electricians, system integrators, plumbers, and building designers.

    • Discovery & Strategy: Mapped existing flows and identified critical friction points caused by the rigid Java interface. Defined a front-end architecture to be fully HTML5-compliant and device-agnostic.
    • Design & Governance: Used Miro for ideation workshops, followed by high-fidelity prototypes in Adobe XD. Crucially, I built a comprehensive design system documented via Zeplin to ensure visual integrity and streamline the design-to-dev handoff.

    The Transformation: Legacy vs. Modern UX

    Diamond Controls (Legacy)
    Screenshot of the old Diamond Controls Java-based interface showing a 3D Floor plan
    Building Connect Plus (New)
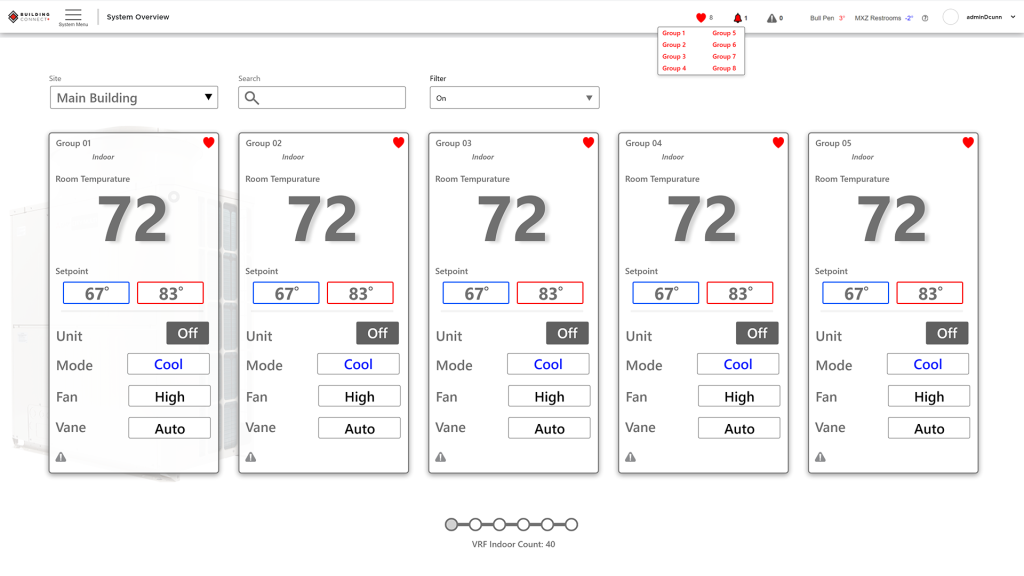
    Clean, monochromatic, data-driven interface designed for rapid consumption in a NOC environment. The design strategy utilized a monochromatic aesthetic to prioritize alerts: color is reserved exclusively for critical warnings and mode status (e.g., Cool/Heat), elevating its communicative impact.

    Key Design Solutions

    1. A Modern, Card-Based System Overview

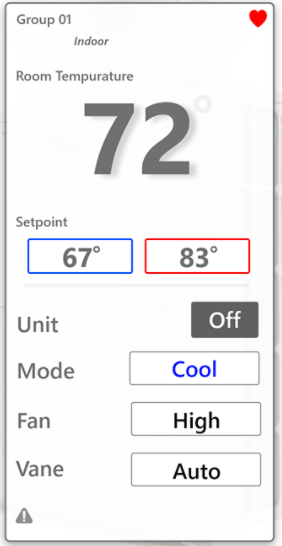
    The main dashboard was redesigned using a card-based layout where each card represents an individual HVAC unit. This allows operators to quickly scan the status of dozens of units across multiple sites, with key information (temperature, setpoint, mode) visible at a glance.

    Screenshot of the new BCP System Overview showing a grid of individual unit control cards.

    2. Seamless Third-Party Control Integration

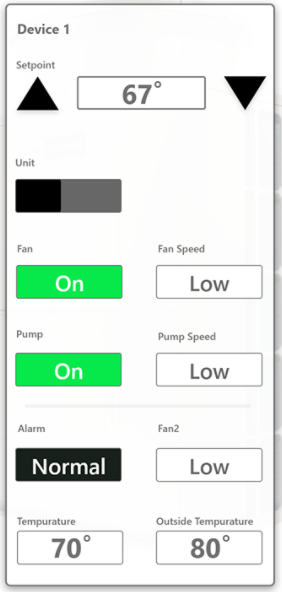
    A core platform requirement was managing non-Mitsubishi equipment. I designed a parallel interface that leverages the same card-based design system to control third-party devices (pumps, fans, etc.). This achieved a consistent, unified user experience, finally providing a true single pane of glass for all building management tasks.

    Screenshot of BCP 3rd Party Equipment control page using the same card layout.

    3. Advanced Diagnostic Tools for Remote Technicians

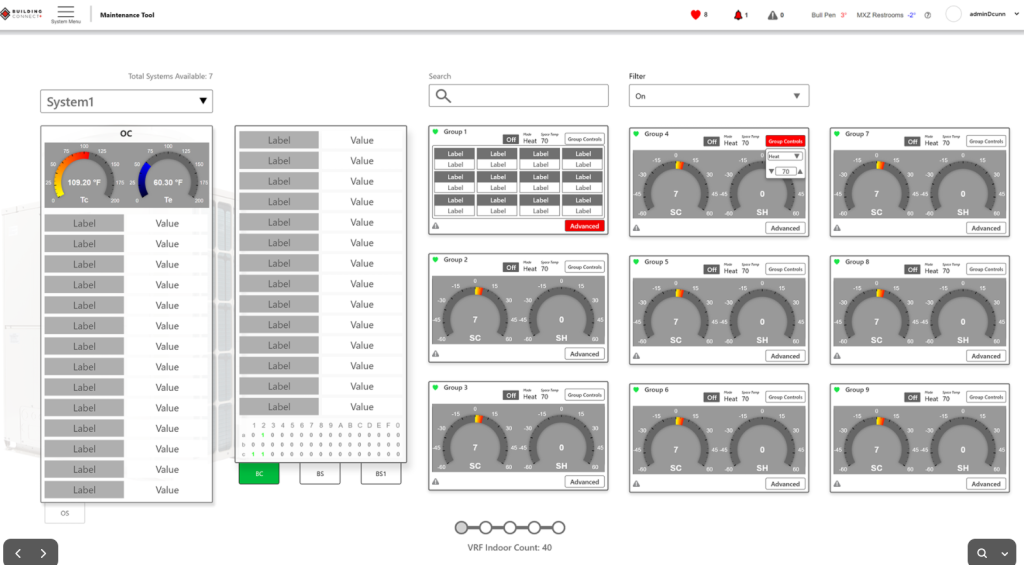
    A dedicated “Maintenance Tool” was built specifically for remote service technicians. This view provides dense, deep diagnostic data and operational values, moving beyond simple controls to enable efficient, off-site troubleshooting and system analysis.

    Screenshot of BCP Maintenance Tool dashboard with gauges and detailed data lists.

    Impact and Key Takeaway (R & L)

    • Technical Debt Elimination: Successfully replaced the obsolete Java application with a modern, performant HTML5 solution, ensuring browser compatibility and device accessibility.
    • Improved Usability: The new, data-driven dashboard dramatically improved operational efficiency for users in NOC environments.
    • Future-Proofing: The strategic architecture and design system established a foundation that is scalable and easily extensible for integrating future innovative, third-party building equipment.
    • Market Positioning: Solidified Mitsubishi Electric’s standing as a leader in innovative, smart building control platforms.

    Key Strategic Learning (L)